Fishbone Analysis for Maintenance: Turning Causes into Corrective Work
Fishbone analysis helps maintenance teams organize possible causes of repeat failures and convert them into evidence-based corrective actions and follow-up work.
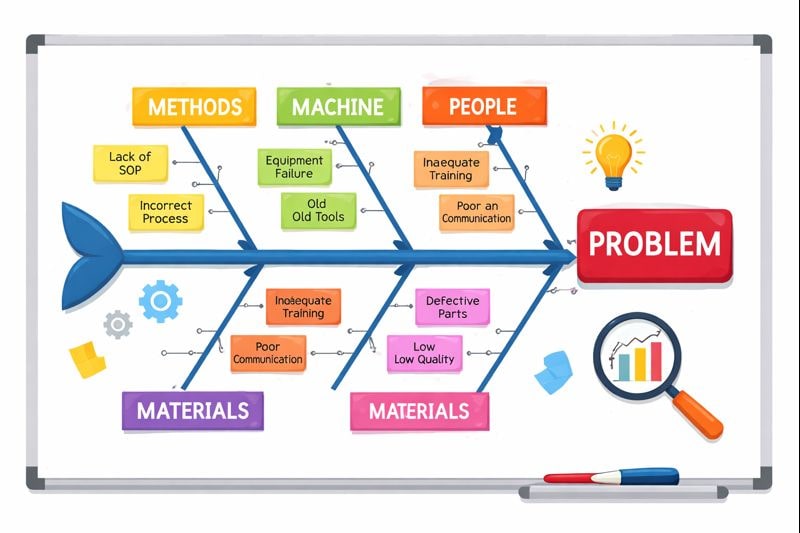
Fishbone analysis is useful when a maintenance team knows a failure is repeating but does not yet know why.
The method is also called Ishikawa analysis or cause-and-effect analysis. It helps teams organize possible causes before jumping to conclusions.
For maintenance teams, the value is simple: stop guessing, structure the discussion, verify the causes, and turn findings into corrective work.
When to use fishbone analysis
Fishbone analysis is useful for problems such as:
- Repeated bearing failures
- Frequent motor trips
- Conveyor belt misalignment
- Pump seal failures
- Hydraulic leaks
- Compressor overheating
- Poor lubrication discipline
- Sensor drift
- Quality defects linked to equipment condition
- Breakdowns that return after every repair
It is not needed for every small issue. Use it when the cost of recurrence is high or when the team keeps fixing symptoms.
The basic fishbone structure
The problem is placed at the head of the fish. Possible causes are grouped into categories.
Common maintenance categories include:
- Machine
- Method
- Manpower
- Material
- Measurement
- Environment
- Maintenance system
Each category helps the team explore different causes instead of blaming the technician or replacing parts repeatedly.
Example problem
Problem statement:
Packaging conveyor stops repeatedly during second shift.
Possible causes may include:
- Machine: worn rollers, misaligned belt, weak motor, damaged sensor
- Method: cleaning procedure skipped, tension setting not standardized
- Manpower: operators not trained to identify early belt tracking issues
- Material: cartons are damp or inconsistent in size
- Measurement: no record of motor current, stop frequency, or sensor faults
- Environment: dust buildup near photo sensors
- Maintenance system: PM checklist does not include belt tracking inspection
This structure keeps the conversation broader and more disciplined.
Evidence matters
A fishbone diagram is not proof. It is a list of possible causes.
The team still needs evidence:
- Work order history
- Breakdown timestamps
- Photos
- Technician remarks
- Operator observations
- Spare part replacement history
- Meter readings
- Inspection results
- Trend data
- Production conditions when failure happened
This is where a work order management software and asset history become important. Without records, fishbone analysis becomes opinion-based.
Ask better questions
Good fishbone analysis depends on the quality of questions.
Instead of asking:
Why did the motor fail?
Ask:
What changed before the failure?
Was the load higher than normal?
Was the same spare replaced before?
Was the PM completed as planned?
Was the alignment checked?
Was there an abnormal reading?
Did the issue happen after cleaning, changeover, or startup?
These questions move the team closer to practical causes.
Convert causes into actions
The most common failure of fishbone analysis is stopping at the diagram.
Every validated cause should become an action.
Examples:
- Update the PM checklist
- Add an inspection point
- Replace a weak component with the correct specification
- Train operators on early signs
- Add a reading or photo requirement
- Improve lubrication frequency
- Correct an installation method
- Create a follow-up work order
- Review spare part quality
A breakdown maintenance software process should connect the analysis to actual corrective work.
What to avoid
Avoid these mistakes:
- Listing causes without evidence
- Blaming people too quickly
- Treating all causes as equal
- Not assigning owners
- Not setting due dates
- Closing the analysis without verifying results
- Failing to update PMs or SOPs
- Not checking whether the failure returns
Root cause analysis is only useful when it changes future behavior.
Bottom line
Fishbone analysis helps maintenance teams organize possible causes of repeat failures. But the diagram is only the beginning.
The real value comes when teams use evidence, validate causes, assign corrective actions, update PMs, and track whether the same problem returns.
MaintBoard supports this by connecting breakdowns, asset history, work orders, inspections, preventive maintenance, corrective actions, and reports in one maintenance workflow.
Frequently asked questions
- What is the main purpose of a Fishbone Diagram?
To identify and visualize all potential causes of a problem, supporting structured root cause analysis.
- What is the 6M Method in Fishbone Analysis?
A framework dividing causes into Man, Machine, Method, Material, Measurement, and Mother Nature.
- What’s the difference between a Fishbone and 5 Whys?
The Fishbone Diagram maps multiple causes, while the 5 Whys drills down into a single chain of causation.
- How do I create a Fishbone Diagram?
Use root cause analysis diagram templates or tools like Lucidchart or Excel to map categories and causes visually.
- Can Fishbone Analysis be used in healthcare or business?
Yes. It’s used across industries — from NHS healthcare RCA fishbone diagrams to manufacturing process improvement.
- What’s an RCA Fishbone Diagram Example?
A structured visual where “Poor Product Quality” is analyzed by mapping potential causes under 6M categories.