Energy KPIs for Maintenance: Metrics That Reveal Equipment Waste
Energy KPIs help maintenance teams find hidden equipment losses such as compressed air leaks, inefficient motors, clogged filters, poor shutdown discipline, and abnormal consumption.
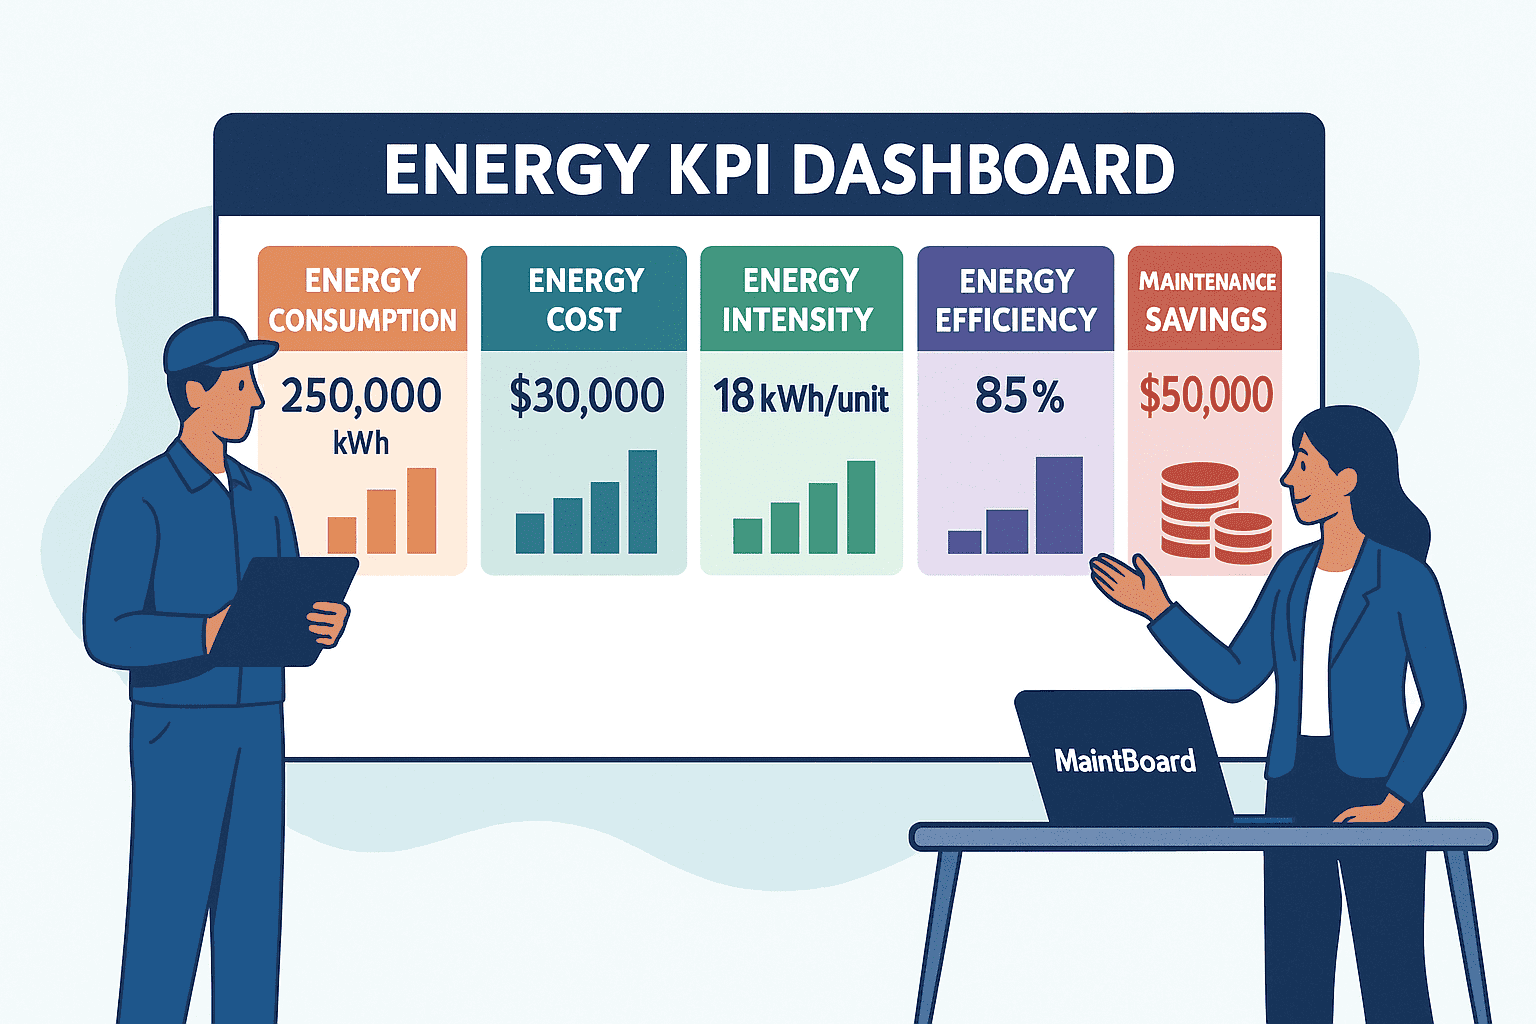
Energy KPIs are not only for sustainability teams. They are also useful for maintenance teams.
Poor equipment condition often shows up as energy waste before it becomes a breakdown. A motor draws more current. A compressor runs longer. A chiller consumes more power. A clogged filter increases load. A leak causes continuous operation.
When maintenance teams track the right energy KPIs, they can find hidden losses earlier.
Why energy belongs in maintenance discussions
Maintenance decisions affect energy consumption every day.
Examples include:
- Compressed air leaks
- Poor lubrication
- Misalignment
- Worn bearings
- Dirty filters
- Fouled heat exchangers
- Overrunning pumps
- Inefficient motors
- Poor insulation
- Incorrect pressure settings
- Equipment left running during idle time
These issues may not immediately stop production, but they quietly increase operating cost and failure risk.
An energy monitoring software workflow becomes more useful when energy data is connected to maintenance actions.
1. Energy consumption by asset
The first useful KPI is energy consumption by asset, area, line, or utility system.
This helps answer:
- Which assets consume the most energy?
- Has consumption increased recently?
- Did consumption change after maintenance?
- Is one similar asset consuming more than another?
- Is energy usage increasing without production increase?
This KPI helps maintenance teams identify assets that need inspection.
2. Energy consumption per production unit
Energy consumption alone can be misleading if production volume changes.
A better KPI is:
Energy per unit = Energy consumed / Production output
If energy per unit increases, the plant may have equipment inefficiency, poor operating practice, utility leakage, or process instability.
Maintenance and production should review this together.
3. Compressed air leak indicators
Compressed air is one of the most common sources of energy waste in manufacturing plants.
Useful indicators include:
- Compressor running during non-production hours
- Frequent loading and unloading
- Pressure drop across the network
- Increasing compressor runtime
- High energy usage with low demand
- Repeated air pressure complaints
A maintenance team should convert confirmed leaks into work order management software tasks, not leave them as informal observations.
4. Idle running time
Idle running time measures how long equipment runs when it is not producing value.
Examples:
- Conveyors running during breaks
- Pumps running against closed valves
- HVAC operating in unused areas
- Compressors running during shutdown
- Lights or utilities left on
- Auxiliary equipment running after production stops
This KPI is useful because many idle losses are behavior and maintenance-control issues, not technology issues.
5. Energy after maintenance
Maintenance teams should review energy before and after certain jobs.
Examples:
- Motor replacement
- Bearing replacement
- Alignment correction
- Filter cleaning
- Compressor service
- Pump overhaul
- Chiller maintenance
- Heat exchanger cleaning
If energy consumption improves after maintenance, it helps prove the value of maintenance work.
If consumption worsens, it may indicate wrong setup, poor commissioning, or an unresolved issue.
6. Abnormal energy trend
A sudden change is important, but gradual drift is often more useful.
Energy trends can reveal:
- Bearing wear
- Clogged filters
- Fouling
- Leakage
- Poor lubrication
- Sensor issues
- Control loop problems
- Equipment degradation
A practical analytics and reporting software setup should help maintenance teams see trends instead of only monthly totals.
7. Energy-related work order count
Plants should track how many work orders are created from energy findings.
Examples include:
- Air leak repair
- Steam trap inspection
- Motor current investigation
- Filter replacement
- Pump efficiency check
- Chiller inspection
- Utility shutdown correction
This shows whether energy monitoring is turning into action.
Energy KPIs without follow-up work do not improve the plant.
8. PM compliance for energy-critical assets
Some PMs directly affect energy performance.
Examples:
- Compressor maintenance
- HVAC filter cleaning
- Cooling tower service
- Pump alignment
- Motor inspection
- Chiller cleaning
- Steam trap checks
- Lubrication routines
A preventive maintenance software process should help track PM compliance for these energy-critical assets.
9. Energy and asset history
Energy data becomes more useful when connected to maintenance history.
A good asset management software setup helps teams compare:
- Energy trend
- Recent breakdowns
- PM history
- Parts replaced
- Operating hours
- Inspection results
- Technician remarks
This helps maintenance leaders understand whether energy waste is related to asset condition.
How to start simply
Do not start with too many energy KPIs.
Start with a few practical ones:
- Energy consumption by major asset or utility.
- Energy per production unit.
- Compressor runtime outside production hours.
- Energy trend for critical assets.
- Work orders created from energy findings.
- PM compliance for energy-critical assets.
Then review these in maintenance meetings.
Bottom line
Energy KPIs help maintenance teams find hidden equipment losses.
The value is not only lower electricity cost. The value is earlier detection of leakage, overload, degradation, poor setup, and maintenance gaps.
MaintBoard helps by connecting energy-related findings with assets, work orders, PMs, technician actions, and reports so maintenance teams can turn energy data into practical action.
Frequently asked questions
- Can I track energy KPIs without integrating meters?
You can estimate, but true visibility comes from direct meter integration.
- How often should I review these KPIs?
Monthly is recommended, but high-consumption assets may need weekly checks.
- Do these metrics apply only to factories?
No. Hospitals, cold storage, and data centers can benefit just as much.
- What’s a good baseline for each asset?
Start with historical averages and adjust as you collect real-time data.