Energy Meter CMMS Integration: Turning Consumption Data into Maintenance Action
Energy meter CMMS integration helps maintenance teams connect abnormal consumption, asset condition, downtime, inspections, and corrective work instead of only viewing energy dashboards.
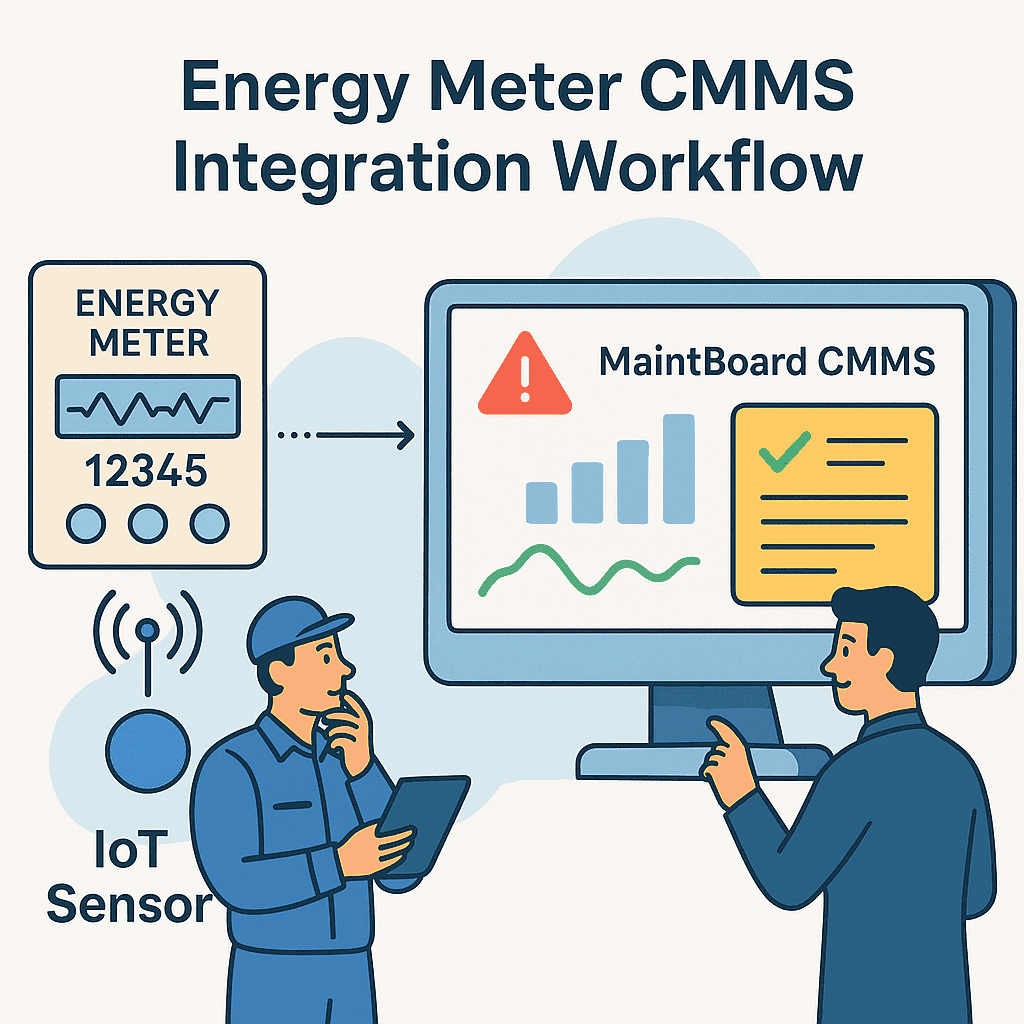
Energy meters can show how much power, compressed air, water, steam, gas, or fuel is being consumed. But meter data alone does not reduce waste.
The real value comes when abnormal consumption leads to maintenance action.
That is where energy meter CMMS integration can help. It connects readings, assets, work orders, inspections, and follow-up actions so the maintenance team can respond to losses instead of only viewing charts.
What energy meters can reveal
Energy meters may expose problems such as:
- Compressed air leakage
- Motor overload
- Pumps running inefficiently
- Chillers consuming more power than expected
- Filters or strainers causing pressure loss
- Machines left running during idle time
- Poor shutdown discipline
- Abnormal consumption after maintenance changes
- Utilities running outside normal baselines
These signals become useful only when somebody owns the response.
Why dashboards are not enough
Many plants install meters and dashboards but still struggle to reduce energy loss.
Common reasons include:
- Readings are not linked to assets
- Abnormal values are not converted into work orders
- Maintenance teams do not know which issue to investigate
- Energy reports are reviewed too late
- Corrective actions are not tracked
- Savings are not connected to completed work
- Root causes are not documented
A dashboard may show the problem. A maintenance workflow is needed to fix it.
What integration should do
A practical maintenance software integration should help teams connect meter data with maintenance execution.
Useful flows include:
- Link meters to assets or locations
- Capture readings automatically or manually
- Compare readings with expected ranges
- Flag abnormal consumption
- Create inspection or corrective work orders
- Record findings, photos, and actions
- Track energy-related defects
- Review repeat issues by asset
This makes energy data part of maintenance, not a separate report.
Examples of energy-driven maintenance work
Energy readings can trigger different types of action.
Examples:
- High compressed air consumption triggers leak inspection.
- Rising chiller energy per operating hour triggers condenser cleaning.
- High pump energy with low output triggers hydraulic inspection.
- Abnormal motor current triggers bearing, alignment, or load investigation.
- High idle consumption triggers shutdown discipline review.
- Repeated utility spikes trigger root cause analysis.
These actions should be tracked as work orders with ownership and due dates.
Connect energy with asset history
Energy loss often builds slowly.
A single reading may not explain much, but asset history can show the pattern.
Useful questions include:
- Did consumption increase after a repair?
- Is the same asset repeatedly causing energy waste?
- Are PMs being completed on time?
- Are filters, belts, bearings, or seals contributing to loss?
- Are energy problems linked to downtime?
- Which corrective actions actually reduced consumption?
A CMMS software helps connect these questions to asset records and maintenance work.
Energy KPIs should lead to work
Energy KPIs become valuable when they drive action.
Track metrics such as:
- Energy per production hour
- Energy per operating hour
- Compressed air loss indicators
- Utility consumption by area
- Abnormal consumption events
- Energy-related work orders
- Corrective actions completed
- Savings after maintenance action
An energy monitoring software approach should help maintenance teams move from observation to correction.
Bottom line
Energy meter CMMS integration is not about collecting more data. It is about turning abnormal energy patterns into assigned maintenance work.
MaintBoard helps teams connect readings, assets, inspections, work orders, corrective actions, downtime, photos, remarks, and reports so energy issues become visible maintenance tasks instead of ignored dashboard signals.
Frequently asked questions
- How much data history should we keep?
Ideally 12–24 months to establish asset baselines and seasonal consumption trends.
- Can we integrate existing meters or do we need new hardware?
If your meters support Modbus, MQTT, OPC UA, or BACnet, you can often integrate them via middleware or edge gateways.
- What is the ROI timeframe?
Most plants see ROI within 6–12 months through energy savings, reduced breakdowns, and better PM targeting.
- Do we need a full-time person to manage this integration?
No. Once integrated, the system can run largely in the background with alerts and dashboards. Admin time is minimal.